Luxembourg most per capita cars in the EU
Periskopi (6 years ago)
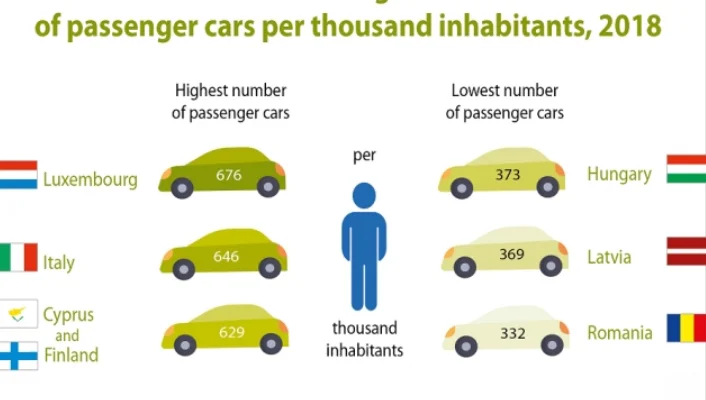
Among the EU member states, Luxembourg registered “the scale of motorisation” higher in 2018, with 676 passenger vehicles per 1,000 residents. It should be considered that this figure can also be influenced by the official cars registered in Luxembourg, which are actually headed by employees whose home is in [...]
Among the EU member states, Luxembourg registered “the scale of motorisation” higher in 2018, with 676 passenger vehicles per 1,000 residents.
It should be considered that this figure can also be influenced by the official cars registered in Luxembourg, which are actually run by employees whose residence is in one of the neighbouring countries. By the way, Luxembourg is followed by Italy with 646, Cyprus and Finland with 629 vehicles.
According to Eurostat data, Romania (332), Latvia (369) and Hungary (373 cars per 1000 inhabitants) have the lowest rates.
In 2018, the largest number of registered passenger vehicles is in Germany, 47 million, followed by Italy (39 million), and France (32 million).
During 2014-2018, there was a significant increase in the number of registered passenger vehicles in several EU member states.
The highest growth was registered in Romania (31 percent), followed by the Czech Republic, Slovakia, and Lithuania (scilla by 19 percent), Hungary and Portugal (with 17 percent) and Cyprus (15 percent).
On the other hand, several EU member states reported a large portion of the oldest passenger vehicles than 20 years in 2018. The highest member states were Poland (36.5 percent), Estonia (29.6 percent), Finland (25.2 percent), Romania (21.4 percent), and Malta (20.8 percent).
By contrast, the share of the newest passenger cars (under two years) was the highest in Ireland (29.2 percent), Luxembourg (23.8 percent), Denmark (23.3 percent), and Belgium (23.1 percent).